Product and Services
Analysis
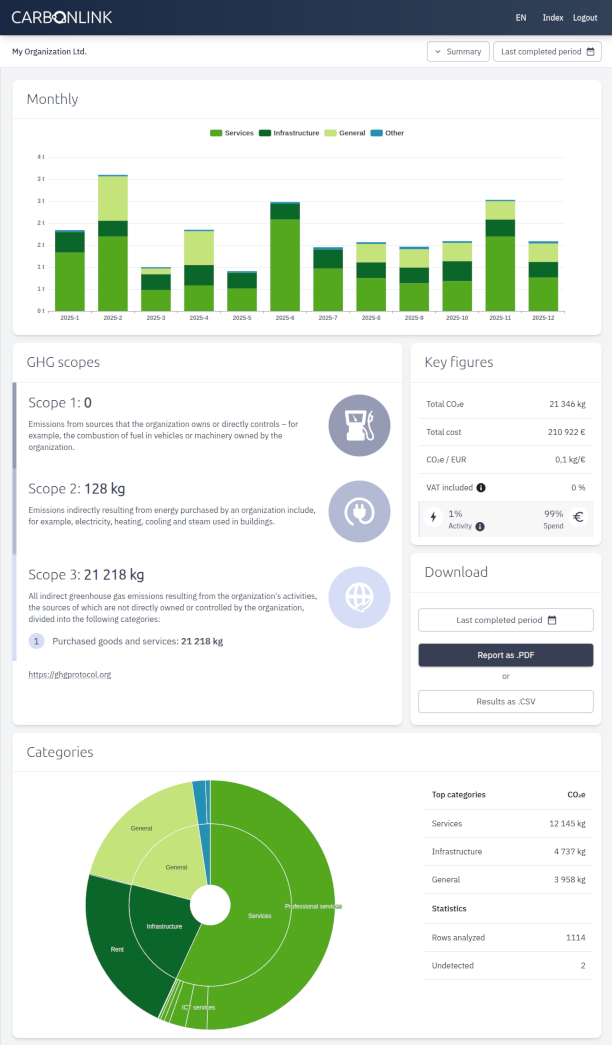
There are many practical features for viewing and analyzing the calculation results:
-
Summary view (pictured)
The main view of the app shows carbon footprint of selected date range. Monthly stacked chart based on categorization is useful for checking what are the main sources of emissions.
-
GHG Scopes
Greenhouse Gas Protocol based categorization is in the core of all emission reporting today. CarbonLink supports this classification and also largerly derives Scope 3 categories based on the data.
-
Row details
Each expense row gets its own calculation result. These results can be viewed in detail, which allows for a precise understanding of emission sources. It is also possible to limit the access to row details for selected users.
-
Trends
Trends view allows users to analyze the changes in carbon footprint over time. This helps in identifying patterns and making informed decisions for reducing emissions.